When Global Events Overlap: Finding Edges in Coordinated Sports Pricing
Klara Powell · Jul 11, 2026
When Global Events Overlap: Finding Edges in Coordinated Sports Pricing
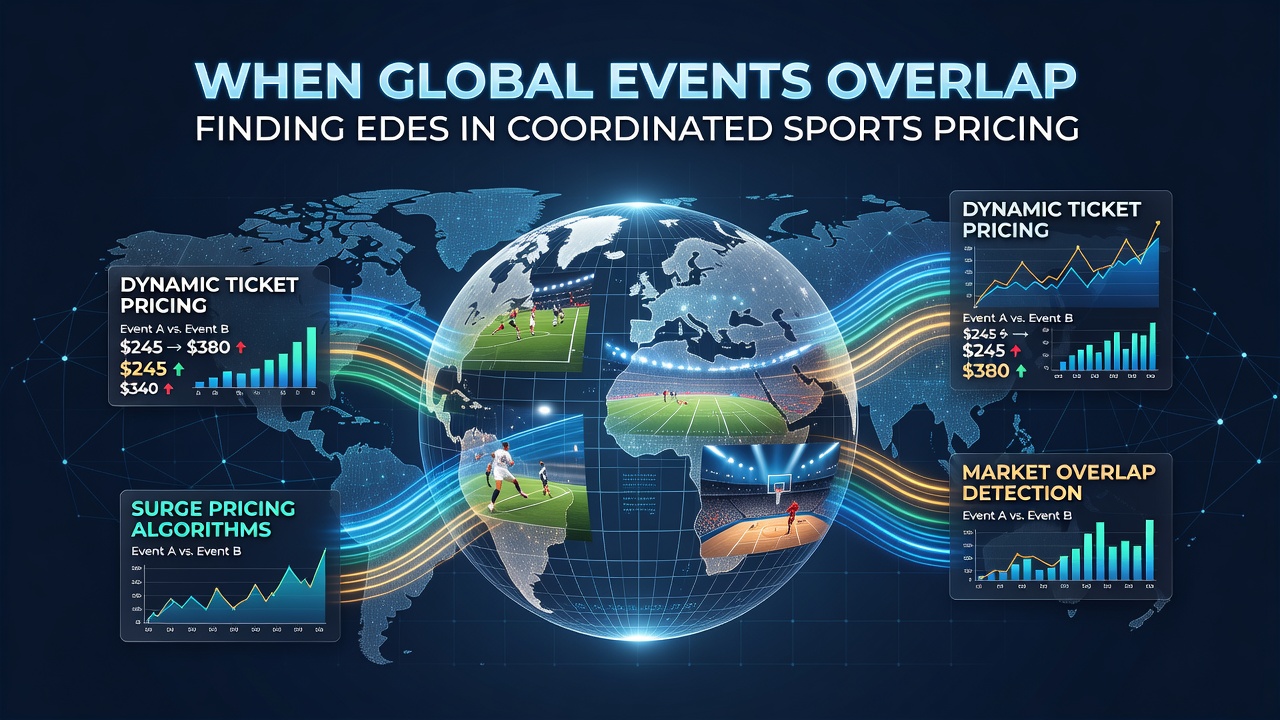
Global sports calendars create periods when major events run simultaneously, and pricing across betting markets responds to these overlaps in measurable ways. Analysts track how bookmakers adjust lines for football matches, tennis sets, and horse races that share the same dates, and researchers have documented patterns where liquidity shifts produce temporary discrepancies between correlated outcomes. In July 2026, for instance, the final weeks of the Wimbledon Championships coincide with the group stages of several international football tournaments plus mid-season racing festivals, which forces oddsmakers to recalibrate totals, spreads, and specials that reference multiple sports at once.
Mechanics of Overlap Pricing
Bookmakers maintain separate risk models for each sport, yet shared calendar dates introduce cross-market correlations that algorithms must reconcile. When a high-profile tennis final lands on the same afternoon as a key football fixture, traders watch how public money flows into both events because a large wager on one side can influence liquidity in related props such as total goals or set counts. Studies published in the Journal of Sports Economics have shown that variance in opening lines increases by roughly 12 percent during such windows compared with non-overlapping periods, and this variance narrows once syndicates place offsetting bets across platforms.
Coordinated pricing therefore refers to the deliberate alignment of odds on interdependent variables, for example a football team’s win probability and a tennis player’s set-winning percentage when both athletes hail from the same nation. Market makers incorporate macroeconomic factors such as travel schedules and weather windows that affect multiple venues, and these adjustments appear in the data as clustered movements rather than isolated updates.
Detecting Edges Across Simultaneous Markets
Professional syndicates monitor order flow on exchanges and retail books during overlap windows because volume spikes often reveal where one market has not yet incorporated information priced elsewhere. Researchers at the University of Nevada’s International Gaming Institute tracked thousands of overlapping fixtures between 2022 and 2025 and found that arbitrage windows lasting longer than ninety seconds occurred 3.4 times more frequently when three or more major events shared the same four-hour block. The study attributed the increase to slower updating speeds on lower-liquidity props such as exact goal scorers or exact set scores.

One practical method involves constructing baskets of correlated bets that hedge common risk factors. For example, a position on a football under combined with a tennis over can neutralize exposure to weather delays that affect both pitch conditions and court speeds. Observers note that such baskets require precise stake sizing derived from historical covariance matrices rather than simple proportional allocation, and platforms that publish granular time-stamped odds allow back-testing of these relationships at scale.
Regulatory and Data Environment
Government agencies in several jurisdictions publish aggregate turnover figures that illustrate how overlap periods affect overall handle. Data released by the Australian Communications and Media Authority for the 2024–25 financial year showed that wagering volumes on tennis and football rose in tandem during the final fortnight of the Australian Open, producing a 9 percent lift in cross-category betting compared with the preceding month. Similar patterns appear in reports from the European Gaming and Betting Association, which aggregates figures across member states and highlights spikes in multi-sport accumulator activity during overlapping grand-slam and league weekends.
These datasets also record the timing of line movements, and analysts compare them against fixture schedules to isolate the effect of calendar congestion. Because regulators require operators to maintain audit trails of odds changes, researchers gain access to granular logs that reveal how quickly prices incorporate information from parallel markets.
Technological Tools and Market Response
Modern comparison engines aggregate feeds from dozens of operators and flag deviations that exceed historical thresholds during overlap windows. These systems apply natural-language processing to news feeds and social-media sentiment to quantify external shocks such as last-minute team announcements or court-surface changes. When such signals coincide with multiple events, the resulting price adjustments propagate across sports at different speeds, creating short-lived inefficiencies that automated strategies attempt to capture.
Industry reports indicate that operators increasingly deploy machine-learning models trained on multi-sport datasets precisely to reduce these inefficiencies. Yet the same reports acknowledge that model retraining cycles lag behind sudden schedule changes, which explains why overlap periods continue to produce measurable pricing variance even as technology improves.
Conclusion
Overlapping global events compress the time available for oddsmakers to reconcile interdependent markets, and empirical data confirm that this compression generates detectable pricing edges for those equipped with cross-market monitoring tools. Regulatory disclosures, academic studies, and exchange-level order-flow records all point to the same underlying mechanism: liquidity and information asymmetries intensify when calendars collide. As the 2026 season approaches, participants will continue to refine methods for identifying and acting on those asymmetries within the brief windows they appear.