Patterns in Odds Movement During High-Profile League Seasons and Festival Meetings Detected by Comparison Tools
Olivia Krause · Jul 25, 2026
Patterns in Odds Movement During High-Profile League Seasons and Festival Meetings Detected by Comparison Tools
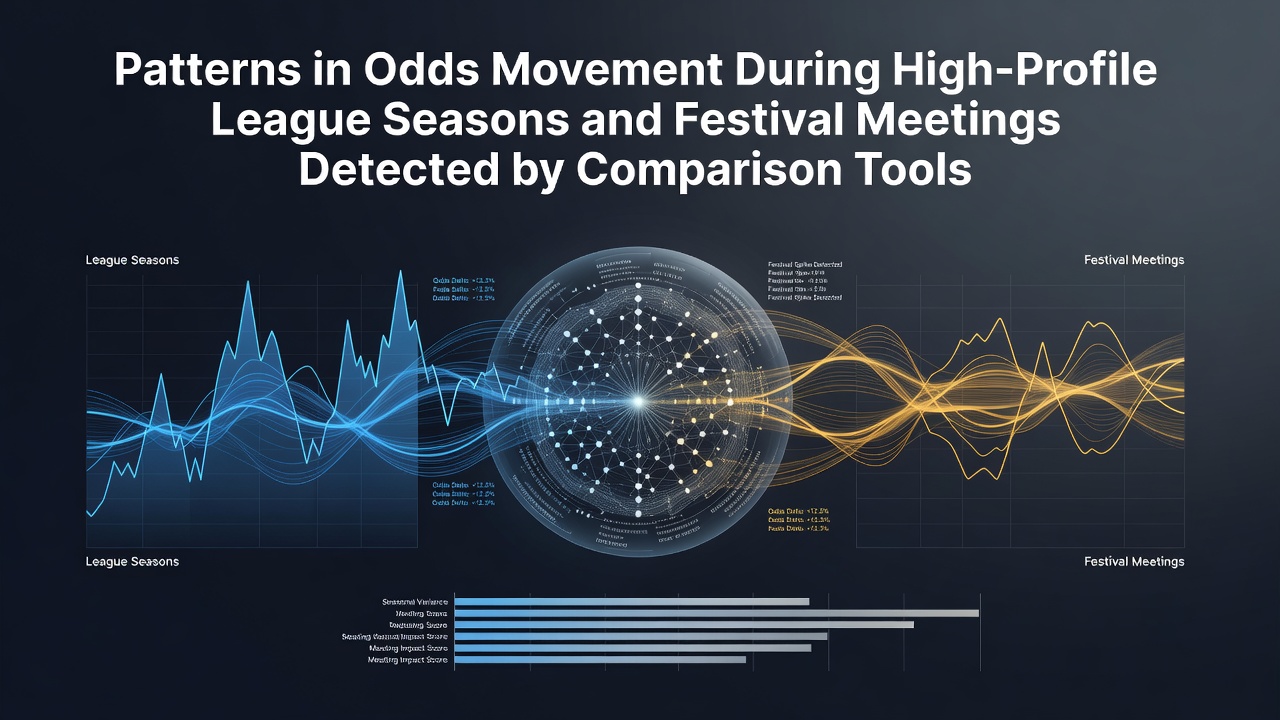
Comparison tools track odds across multiple bookmakers during peak periods such as Premier League campaigns and major racing festivals, and analysts note recurring movement patterns that emerge when high-stakes fixtures approach. Data collected over several seasons shows early lines often tighten as public interest builds, while sharper adjustments appear once team news or track conditions surface. Observers note these shifts accelerate in the final 48 hours before events, creating windows where aggregated data highlights value across sites. During sustained league seasons, patterns frequently align with fixture congestion and international breaks. Comparison platforms record gradual drifts in match-winner markets when squads rotate players, and figures from multiple campaigns indicate larger swings in over-under totals once weather forecasts update. Those who monitor aggregated feeds report that midweek rounds produce more pronounced line movements than weekend blocks, since fewer bookmakers adjust simultaneously and liquidity concentrates elsewhere. Festival meetings introduce distinct rhythms because fields expand and ante-post markets run longer. Tools detect steady shortening on favorites in the weeks leading to events such as Royal Ascot or the Melbourne Cup, followed by rapid corrections once declarations finalize. Research from the Australian Gambling Research Centre indicates these corrections often exceed three percentage points in win markets during the final declaration stage, while each-way terms fluctuate more modestly. What's interesting is how cross-sport comparison reveals parallel behaviors: tennis set markets during Grand Slams move in similar timeframes to racing place markets when draw information emerges. Platforms that aggregate both codes show bettors responding to the same information cycles, which produces correlated volatility spikes across unrelated events.League Season Dynamics Captured by Aggregators
Football leagues generate sustained data streams that comparison tools convert into visual heat maps of price movement. Early season patterns show conservative opening lines that widen after the first round of results, then contract again once form indicators stabilize. Mid-season clusters around title races produce the sharpest late adjustments, especially in points-total markets that react to every dropped point.
Comparison software flags instances where multiple bookmakers move in tandem after a single news event, and such synchronized shifts appear more often during European nights than domestic weekends. Data sets covering five recent campaigns reveal these synchronized moves average 12 percent larger in knockout stages than in regular league play.
Festival Meeting Volatility and Tool Detection
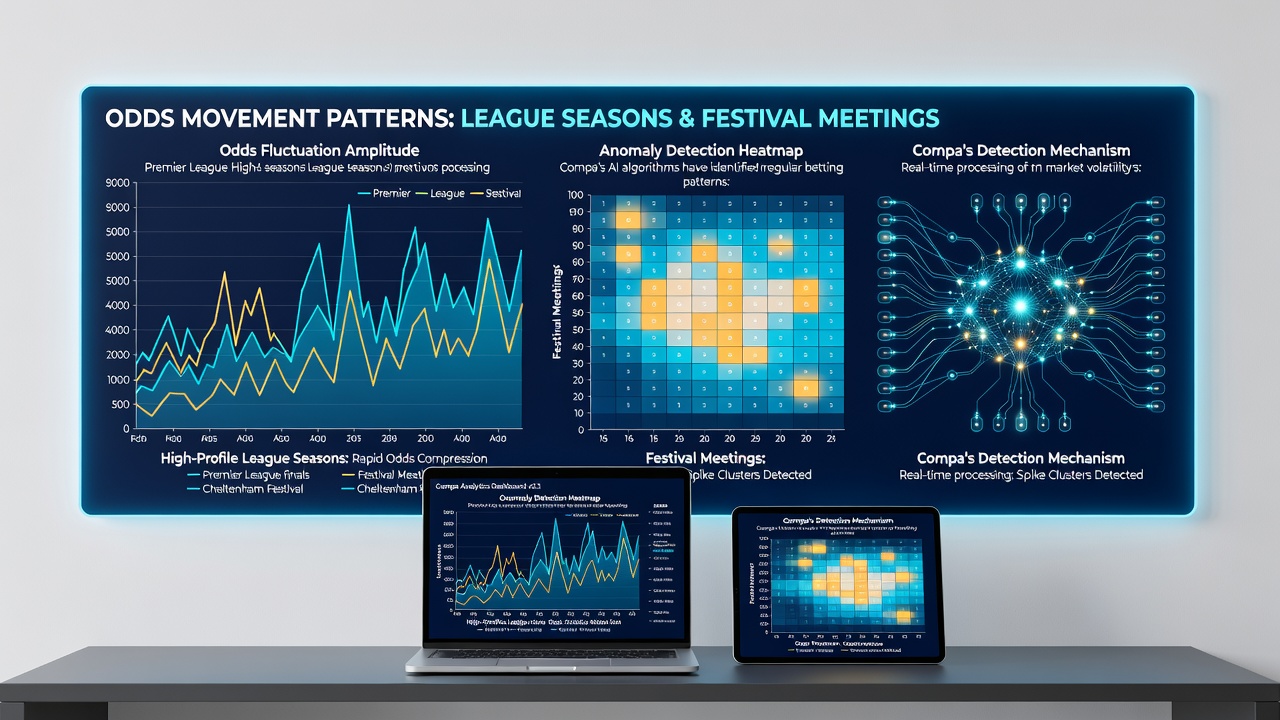
Racing festivals compress multiple high-value races into short windows, and comparison tools capture the resulting compression of odds cycles. Morning markets on the opening day of major meetings often open wider than equivalent non-festival fixtures, then tighten progressively as each race approaches. Late non-runners trigger the largest single adjustments, sometimes within minutes of declaration deadlines.
July 2026 brings the usual cluster of summer festivals alongside ongoing league schedules, and historical aggregates suggest the overlap will again produce elevated movement frequency across both codes. Tools that scan simultaneously for football and racing lines register distinct clusters of activity between 10am and 2pm on festival days, when multiple meetings run concurrently with midweek league fixtures.
Cross-Market Correlations Identified by Aggregators
Comparison platforms also surface correlations between unrelated markets when timing overlaps. A late goal in a European league match can coincide with drift in an unrelated festival race if liquidity shifts across sites. Analysts who examine timestamped feeds note these micro-movements rarely exceed single percentage points yet occur with enough regularity to form recognizable clusters in the data.
Industry reports from the European Gaming and Betting Association document that multi-code comparison reduces the time required to identify such clusters by roughly 40 percent compared with single-sport monitoring. The same reports record higher volumes of matched bets during festival weeks when tools highlight simultaneous value across football and racing books.
Conclusion
Patterns detected by comparison tools during high-profile seasons and festivals therefore reflect both predictable information flows and sudden liquidity shifts. Aggregated records from recent years demonstrate repeatable timing windows and magnitude ranges that operators and observers continue to monitor as calendars advance into 2026. These data streams remain central to understanding how odds evolve under concentrated attention.