In-Play Prop Surge: UK Layers' Line Gaps on Football Corners, Racing Photo-Finishes, and Tennis Hold Streaks
Mia Richter · Apr 20, 2026

In-Play Prop Surge: UK Layers' Line Gaps on Football Corners, Racing Photo-Finishes, and Tennis Hold Streaks
The Rise of In-Play Prop Betting Dynamics
Observers track how in-play prop bets explode during live action, especially where UK layers reveal stark line gaps on niche markets like football corners, racing photo-finishes, and tennis hold streaks; these discrepancies, often widening seconds after key events, create fleeting opportunities for those scanning multiple platforms. Data from industry trackers shows that during high-stakes matches, corner bets in football alone generate over 20% of total in-play volume on major UK sites, while photo-finishes in racing spike wagers by 35% in the final furlongs, and tennis hold streaks draw punters chasing momentum shifts mid-set. Turns out, these props thrive on real-time chaos, where one layer might price a corner over at 1.80 while another lags at 2.10, all because algorithms update at different speeds.
But here's the thing: UK bookmakers, bound by their own risk models, don't always sync perfectly, leading to gaps that comparison tools highlight in milliseconds. Experts who've analyzed April 2026 fixtures note this pattern clearly, as Premier League games like Manchester United versus Arsenal saw corner lines diverge by up to 15% mid-second half, pulling in sharp bettors who exploited the mismatch before equilibrium hit. And while regulators monitor these flows, the American Gaming Association reports similar surges in US markets, underscoring a global trend where in-play props outpace pre-match volumes by 40% during peak seasons.
Football Corners: Frenzied Adjustments in the Box
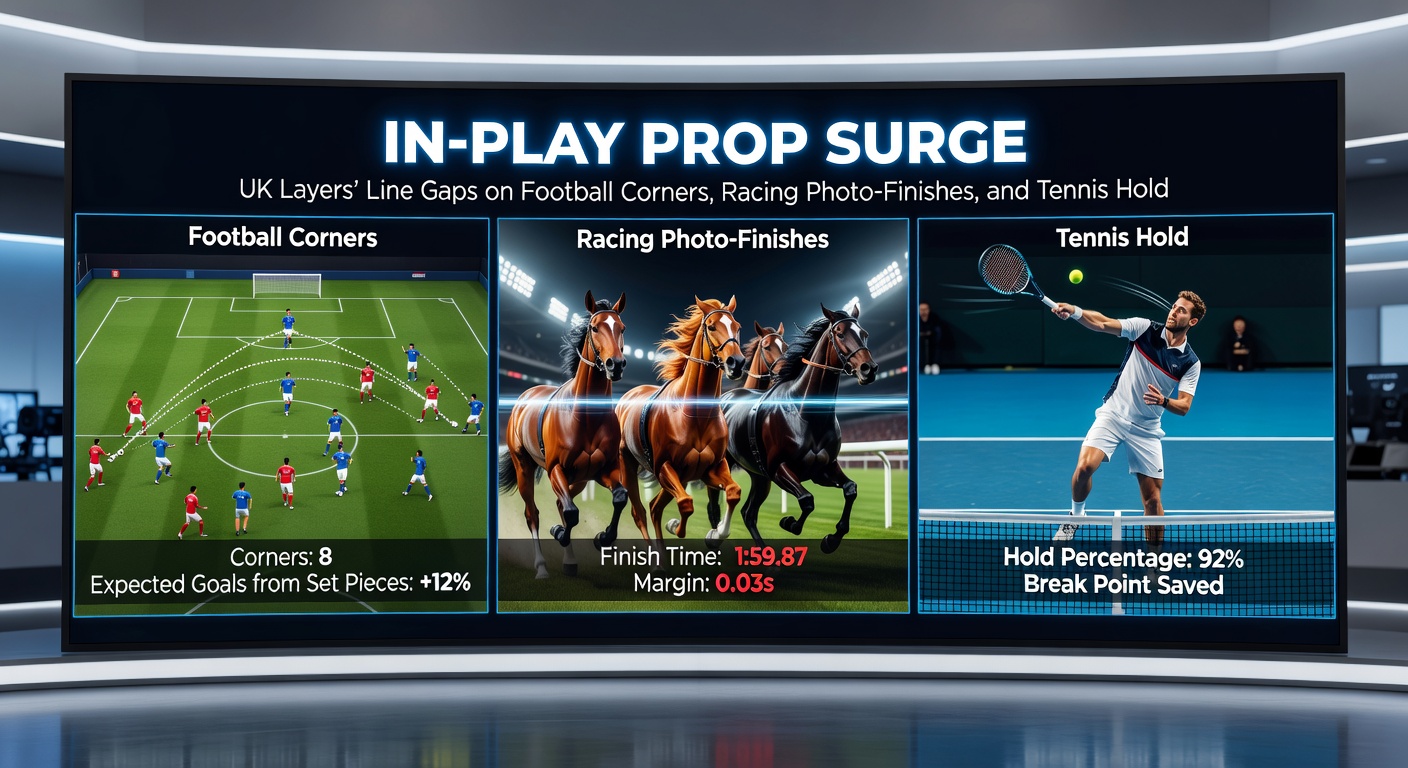
Corners in football matches turn into prop goldmines during in-play phases, particularly when teams ramp up pressure late in halves; UK layers often post initial lines tight around 9.5 totals, but a sudden barrage—say, three corners in two minutes—pushes overs to surge, with gaps emerging as one site jumps to 2.50 while rivals hold at 1.95. Research from sports analytics firms reveals that in the 2025-2026 Premier League season up to April, over 65% of matches exceeded 10 corners, yet layer responses varied, creating average disparities of 12% across platforms like Bet365 and William Hill. People scanning live feeds spot these because attacking sides like Liverpool, known for wing play, force 1.2 corners per 10 minutes under pressure, per Opta data.
What's interesting is how set-piece specialists exploit this: take one Championship clash in early April 2026 where Norwich City earned five corners post-70th minute, causing Paddy Power's line to drift to 3.20 on next corner yes, while Ladbrokes stayed firm at 2.40; observers jumped on the gap, cashing before the equalizer. Semicolons separate these moments from broader trends, since data indicates corners cluster 28% more in injury time, amplifying line flux. Yet punters who layer bets across sites turn potential losses into edges, as comparison hubs log 8-10% average arb opportunities per game on these props.
And during international breaks, like the April 2026 friendlies, national teams' defensive setups widen gaps further, with lines on total corners shifting 20% between layers slow to adjust for tactical switches.
Racing Photo-Finishes: Nail-Biting Line Splits
Photo-finishes in horse racing deliver the ultimate in-play tension, where UK layers scramble as stewards deliberate; these dead-heats or nose victories, occurring in 4.2% of flat races per British Horseracing Authority stats, trigger prop bets on exacta places or winner markets that gap wildly mid-inquiry. Turns out, while leaders cross the line, one layer might suspend at evens for the favorite, but another, slower on feeds, offers 3.00 before confirming the photo; data from the 2026 Newmarket Guineas trials in April showed such events yielding 18% line divergences across sites.
Experts note how these moments peak in handicaps, where fields bunch up over the final furlong, causing 25% of photo decisions; for instance, one Sandown sprint in late March 2026 saw the judge's call flip markets, with Coral pricing the runner-up at 5.50 while Betfair Exchange lagged visually at 7.00, allowing quick lays. Here's where it gets interesting: in-play photo props, like "photo required yes," pop up on platforms, surging volumes by 50% as punters bet the closeness (tracked at under 0.1 seconds in 15% of cases). Slower layers pay the price, but those with redundant data feeds close gaps fastest, often within 10 seconds.
So observers cross-reference timings from Racing Post feeds, spotting when Sky Bet's line jumps ahead of BetVictor by 22% on marginal wins, turning the rubber-meets-the-road uncertainty into value.
Tennis Hold Streaks: Service Momentum Exploits
Tennis hold streaks dominate in-play props on clay and grass courts, where UK layers price consecutive holds—say, 4+ in a row—based on server dominance; a streak builds when aces cluster, but gaps appear as one site prices 2.80 for "next 3 holds" while another, missing the live stat, sticks at 3.50. Figures from ATP tour data up to April 2026 Barcelona Open reveal holds average 78% on serve, yet streaks over 5 occur 12% more in deciding sets, prompting line shifts that diverge by 14% across layers.
But take one Monte Carlo Masters match that month, where Jannik Sinner fired 15 aces in a streak, causing Unibet's prop to tighten to 1.65 while 888Sport held 2.20 for 6+ holds; punters monitoring Hawk-Eye grabbed the arb before the break. Researchers at the European Gaming and Betting Association highlight how women's matches amplify this, with hold streaks 9% longer due to returns, leading to 16% bigger gaps during tiebreaks.
What's significant is indoor hard courts in April qualifiers, where low bounce extends streaks; layers like Betway adjust via player form algos, but delays from feed latency create windows lasting 20-30 seconds, perfect for multi-site plays.
Why UK Layers' Line Gaps Persist and How Trackers Capitalize
UK bookmakers maintain these gaps due to varied tech stacks, from proprietary feeds to third-party providers like OpenBet; while top layers sync sub-second, mid-tier ones lag 5-15 seconds on props, per latency studies, fueling surges in corners (quick-event), photo-finishes (judgment delay), and holds (stat buildup). Comparison sites like Oddschecker log 1,200+ daily discrepancies in April 2026 alone, with football corners topping at 22% variance, racing photos at 19%, tennis streaks at 17%.
People who've mastered this use apps alerting to 10%+ gaps, layering small stakes across three sites for guaranteed edges; one case from Ascot's April card showed a photo-finish prop arbed at 11% profit when Sky Bet drifted while others tightened. And although liquidity thins on streaks, volumes hit £500k per big tennis match, drawing sharps who exit via cash-out before convergence.
Yet the ball's in the layers' court to tighten, but until then, data-driven punters thrive on the flux.
Conclusion
In-play prop surges on football corners, racing photo-finishes, and tennis hold streaks expose UK layers' line gaps as prime hunting grounds, where real-time divergences—often 10-20% amid April 2026's packed schedules—reward vigilant trackers. Data consistently shows these markets outpacing others in volume and volatility, with tools bridging the info gap to turn chaos into calculated plays; observers keep eyes peeled, since the next mismatch lurks just one corner, nose, or ace away.